Understanding the BCG Growth-Share Matrix Framework
The BCG Growth-Share Matrix is a strategic management tool developed by the Boston Consulting Group. Designed to help multidivisional corporations analyse their business units, product lines, or strategic assets, the matrix evaluates entities based on two primary dimensions:
Market Growth Rate (Vertical Axis): Measures the attractiveness and overall growth speed of the industry or market segment in which the unit operates. High growth indicates expanding commercial opportunities, whereas low growth signals market saturation or maturity.
Relative Market Share (Horizontal Axis): Serves as a measure of a firm’s competitive strength, calculated as its market share relative to its largest direct competitor. High relative market share generally yields economies of scale and cost advantages, leading to superior cash generation.
The following is based on public available information, not necessarily on annual reports.
First the theory bit….
The combination of these axes creates four quadrants:
Stars (High Growth, High Relative Market Share): Market leaders in fast-growing industries. They generate significant revenues but require substantial capital investment to defend their dominant position against aggressive competitors.
Cash Cows (Low Growth, High Relative Market Share): Strong leaders in mature, slower-growing markets. Because industry growth has stabilised, these assets require minimal reinvestment to maintain their positions, generating large net cash inflows that fund other ventures.
Question Marks / Problem Children (High Growth, Low Relative Market Share): Units in expanding markets that hold small market shares. They consume vast amounts of cash to keep pace with growth, yet face an uncertain strategic path; they must either capture market share to become Stars or risk devolving into Dogs.
Dogs (Low Growth, Low Relative Market Share): Entities operating in stagnant or declining markets with weak competitive positions. They typically generate negligible net positive cash flows and can drain executive attention and resources.
Applying the BCG Matrix to London stadia
London Football Stadiums
To apply the BCG Matrix to London's commercial football landscape, stadium assets are evaluated using modified variables suitable for venue economics:
Market Growth Rate (Vertical Axis): Evaluated through matchday venue expansion trends and modern commercial diversification growth rate (non-matchday event capacity, premium hospitality scaling, multi-sport hosting flexibility, and neighbourhood re-development potential).
Relative Market Share (Horizontal Axis): Measured via stadium capacity and commercial revenue-generation efficiency relative to the leading club venue in London (Tottenham Hotspur Stadium).
Mapping the London Stadium Matrix
Evaluating the core London club venues illustrates how different stadium strategies function across the four BCG quadrants:
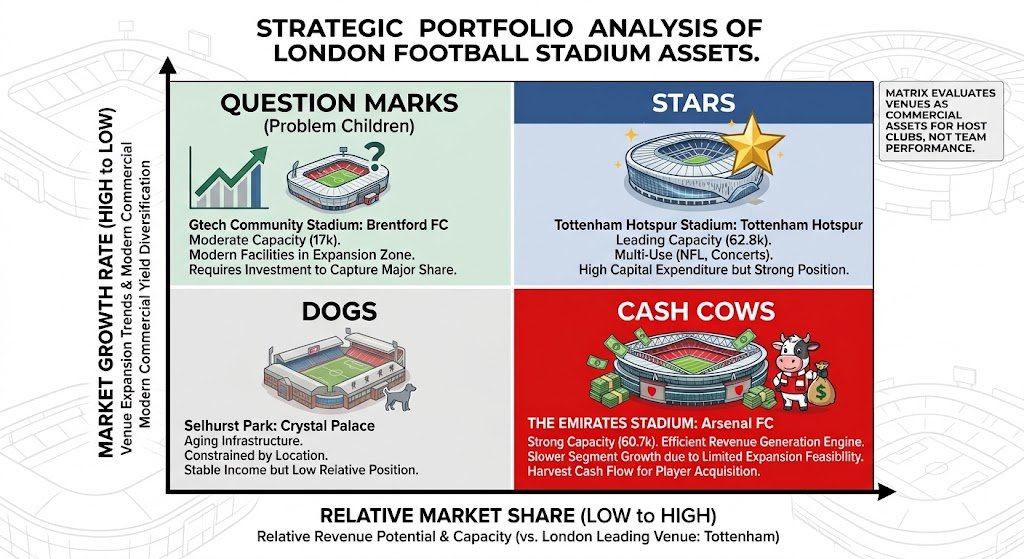
Stars — Tottenham Hotspur Stadium (Tottenham Hotspur):
Opened in 2019 with a capacity of 62,850, it represents London's benchmark venue asset. Featuring a fully retractable pitch, dedicated NFL facilities, multi-concert infrastructure, and high-margin hospitality, it sits in a high-growth sector with the largest club venue capacity in London.
Question Marks — Gtech Community Stadium (Brentford):
Holding a modest capacity of 17,250, Brentford's venue operates in an expanding Premier League platform. It boasts modern digital infrastructure and efficient land utilisation, but its small absolute size limits market share compared to North London giants.
Dogs — Selhurst Park (Crystal Palace):
Holding 25,500 seats, Selhurst Park suffers from structural limitations, restricted expansion capabilities, and aging infrastructure. It operates in a low-growth physical expansion environment with low relative market share compared to modern regional alternatives.
Cash Cow — Emirates Stadium (Arsenal):
Holding a 60,700 capacity, the Emirates acts as a commercial engine. Since opening in 2006, it consistently delivers top-tier revenues with fully amortised debt loads and low ongoing maintenance overhead.
Arsenal's Emirates Stadium
The Emirates Stadium sits squarely in the Cash Cow quadrant of the BCG Matrix.
Emirates stadium compared to other London stadia
High Relative Market Share
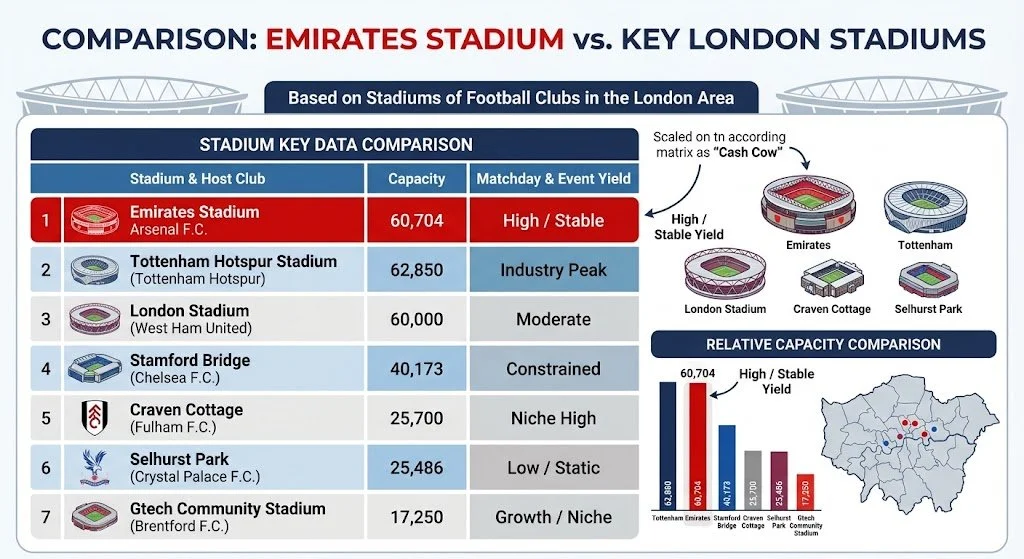
Arsenal’s home ground holds the second-largest capacity among London club stadiums, trailing Tottenham Hotspur Stadium while edging out West Ham’s leased London Stadium and Chelsea’s constrained Stamford Bridge.
Because Arsenal owns the land, stadium operational rights, and matchday concessions outright, its cash yield per seat remains near the top of European football.
Low Market Growth Rate
The physical venue market for the Emirates Stadium has entered a mature, slow-growth phase. Constructed in 2006, the stadium revolutionised matchday revenue generation in English football by replacing Highbury.
However, two decades after its opening, organic capacity growth has reached a plateau. Strict Islington Council planning permission, constrained urban transport links at Holloway Road and Arsenal Tube stations, and a fixed architectural shell limit major physical expansion without immense capital outlays.
Strategic Implications for Arsenal
Operating a Cash Cow asset dictates specific management strategies under BCG principles:
1. Harvest Cash Flow to Fund Core Competitiveness
A Cash Cow’s primary mandate is generating capital to fund other high-growth divisions. The immense, predictable cash flows generated by the Emirates Stadium, driven by high-priced general admission and premium club-level seating, directly underwrite Arsenal’s primary competitive growth engine: player acquisitions, wage bills, and academy development.
2. Tactical Modernisation Without Heavy Capital Risk
Because the Emirates operates in a low-growth venue segment, massive structural overhauls carry diminishing returns. Instead, strategic focus shifts toward mid-scale modernisation:
Digital Upgrades: Installing modern audiovisual arrays, friction-free point-of-sale systems, and high-density 5G infrastructure to maintain fan experience standards without requiring structural rebuilds.
Hospitality Reconfiguration: Converting underutilised corporate boxes or standard seating blocks into experiential, high-margin lounges to extract higher yield per square meter.
3. Preventing Transition into "Dog" Territory
Without steady upkeep, Cash Cows risk deteriorating into Dogs over time. As newer venues like the Tottenham Hotspur Stadium redefine luxury fan experiences, Arsenal must continuously refresh infrastructure, concourse options, and corporate suites to preserve its premium pricing power in the capital.
In Conclusion
Arsenal should treat the Emirates Stadium primarily as a reliable cash engine, leveraging its robust 60,704 capacity to consistently fund Arsenal’s broader competitive ambitions on the pitch. Because major physical expansion is severely constrained by urban geography and strict local council planning laws, avoid high-risk capital expenditures on structural enlargement. Maximise per-seat revenue by reconfiguring traditional corporate areas into experiential, high-margin hospitality lounges and upgrading digital infrastructure to elevate the live fan experience.
Therefore, management must actively guard against competitive stagnation. As newer venues like Tottenham Hotspur Stadium raise the regional benchmark for multi-use entertainment and luxury amenities, smart, incremental investments in stadium modernisation, energy efficiency, and fan engagement are vital. This disciplined approach ensures the venue retains its status while continually feeding the club’s long-term sporting success.